Did you know there are nearly 140 different community indicators on Yakima Valley Trends - each updated throughout the year? But which ones, and when?
This issue of the Yakima Valley Trends blog lists some of the most recently updated indicators on the Yakima Valley Trends website.
This page will be updated and email alerts sent on a quarterly basis. Don't miss an update - subscribe today!
Recent Updates
In PEOPLE: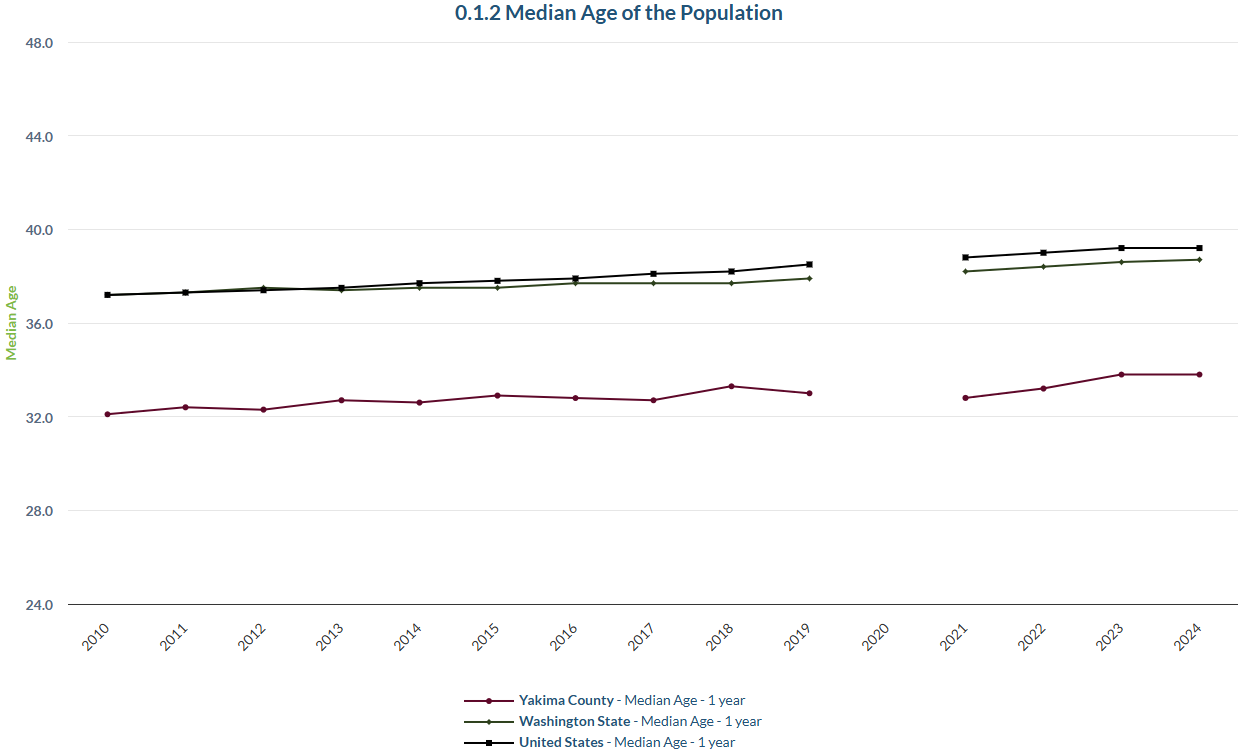
Yakima County’s population is aging more rapidly than the U.S. or Washington.
The median age is a quick way of sizing up the overall age structure of a population. It divides a set of numbers into two equal halves. Census estimated that for 2024, the median age in the county was 33.8 years. This is 0.8 years older than five years prior.
As is easily seen, Yakima County still remains a young place, compared to the nation and state. Median ages of those benchmarks in 2024 were 39.2 and 38.7, many years older than here. Based on percentage change calculations, however, the median age here has advanced faster than those of the U.S. or Washington over the past five years.
To view a more detailed breakdown of the population by age groups, see indicator 0.1.3.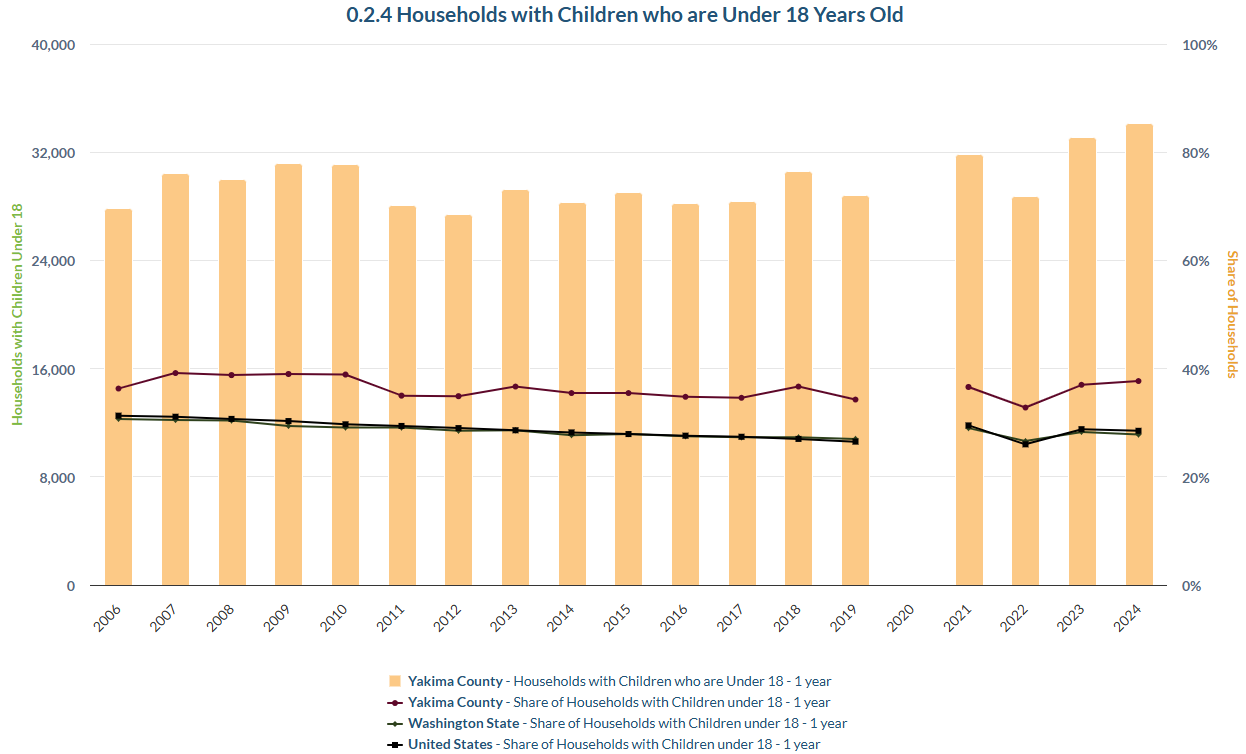
The number of households in the county with children under 18 years continues to expand.
Yakima County is “children-rich” community. For 2024, Census estimates put the number of households with children up to 18 years of age at over 34,000. This is the highest estimate yet, representing 38% of all households in the county.
Compare this assessment to those of the U.S. and Washington; the share of households with children here is nearly 10 percentage points higher.
In CULTURE, RECREATION, TOURISM: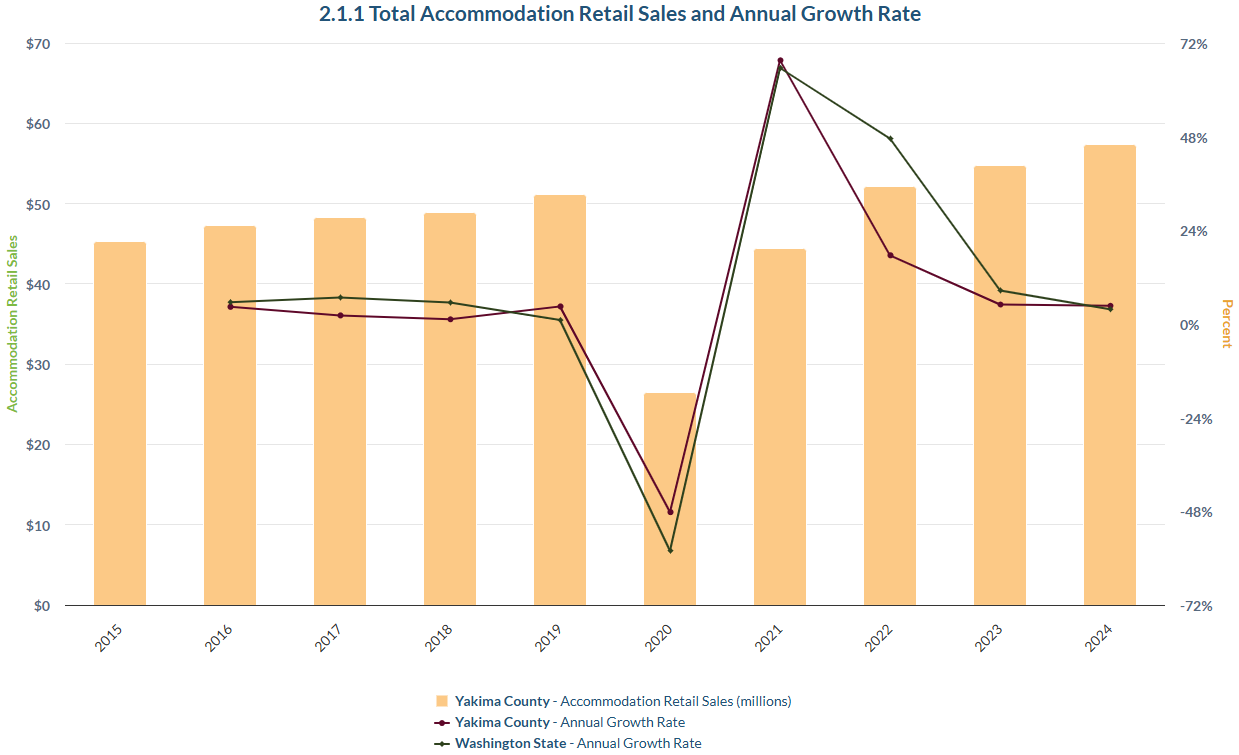
Accommodation retail sales are now growing at the same pace as statewide.
Revenues at hotels, B&Bs, motels and VRBO units give the cleanest view of the direction of tourism. These flows do not capture all visitor spending, but they carry the advantage of not co-mingling (in most cases) residents’ with visitors’ spending. And tourism is an important leg of the local economy.
For 2024, the most recent year with complete revenue data, accommodations establishments revenue exceeded $57 million. This is the highest amount to date and beat the pre-pandemic results of 2019 by $6 million. Note that while Yakima County lagged the state growth rate for two years, post-pandemic, it slightly surpassed that average rate in 2024.
In ECONOMIC VITALITY: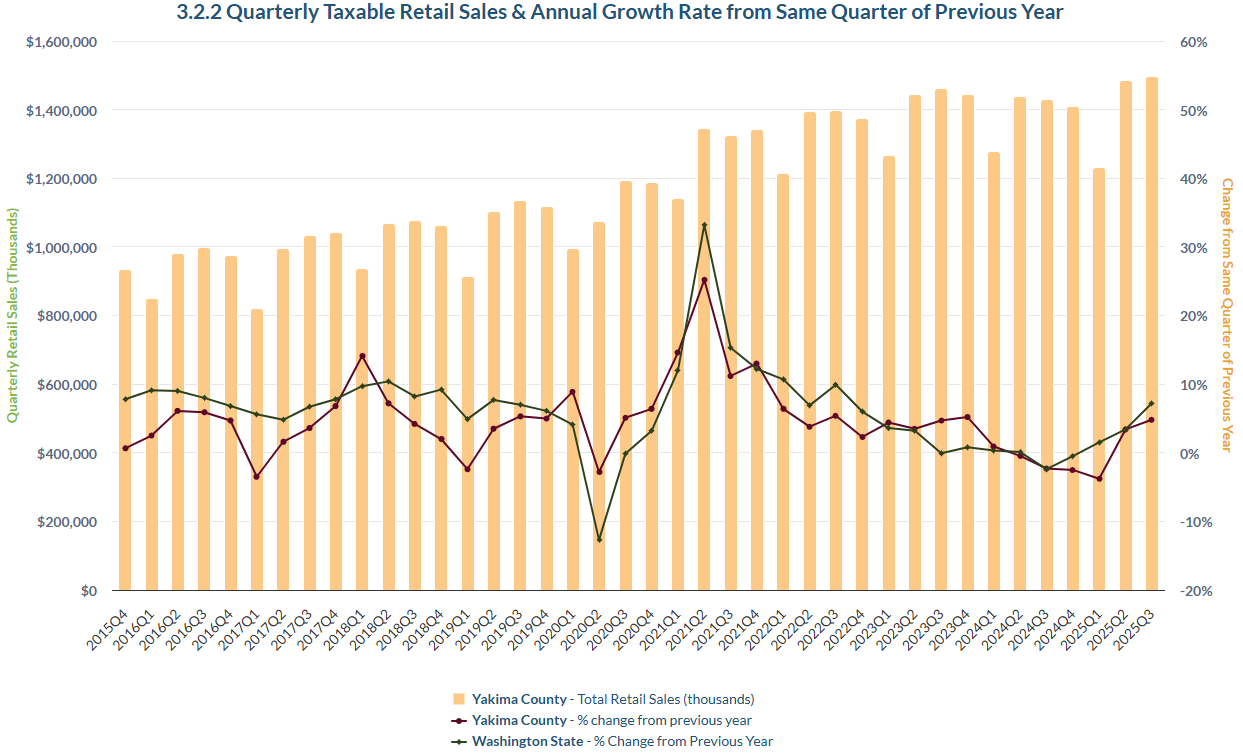
Retail sales are an important measure of the strength of local economy in Washington state. In particular, the results largely track the pulse of two important sectors: retail trade and construction.
The first three quarters of 2025 revealed County taxable retail sales growing by the following percentages: -3.8%, 3.4% and 4.8%, or a simple average of nearly 1.5%. This was below the average state rate over same period of about 4%. Except for two quarters in 2023, taxable retail sales growth in the county has lagged that of the state since 2021.
In ENVIRONMENT: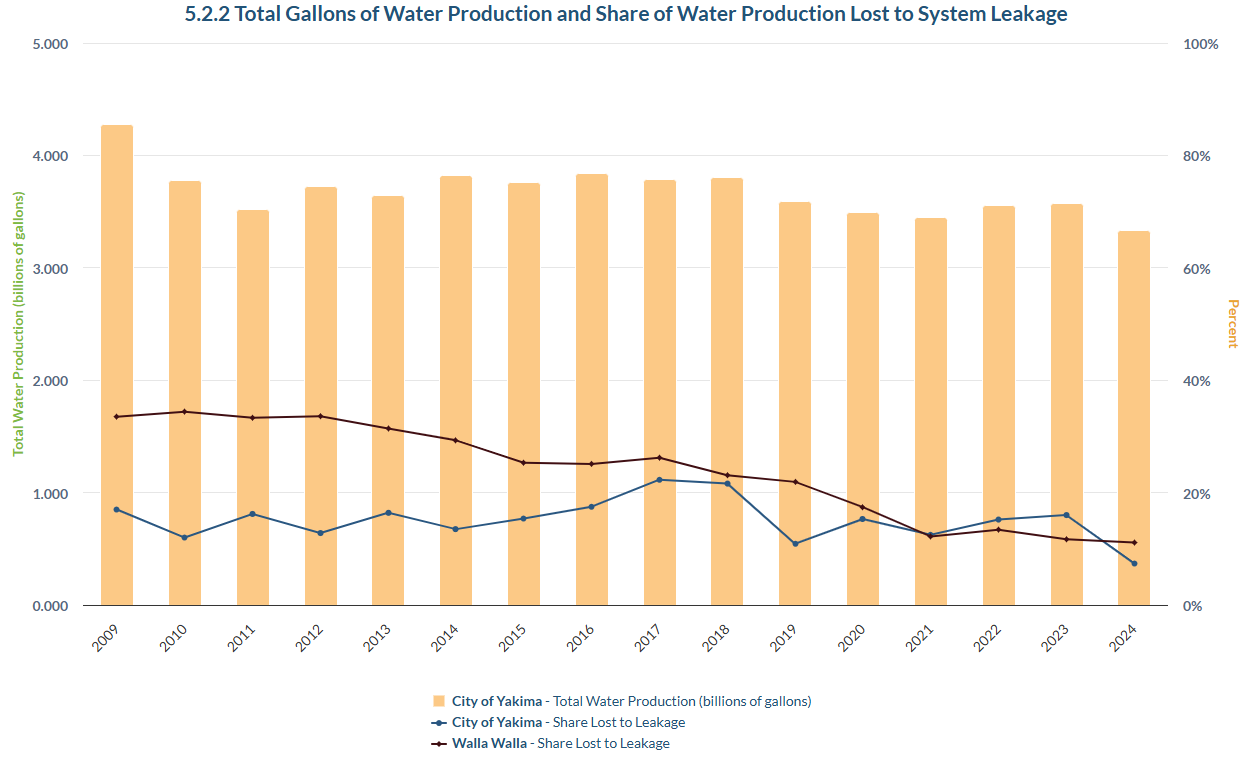
City of Yakima volume of water pumped & system leakage shows increasing conservation.
As everyone in the county now knows, access to water is increasingly vital. The Washington Department of Health tracks production and efficiency for water districts serving residential customers. The Trends offers an indicator for the city of Yakima.
2024 represented the lowest volume of water pumped on record: 3,300 billion gallons. Similarly, the amount of water “lost” in the city’s distribution system was the lowest on record, at 7.4%. This rate is considerably lower than those of the Tri Cities and Walla Walla.
In HEALTH: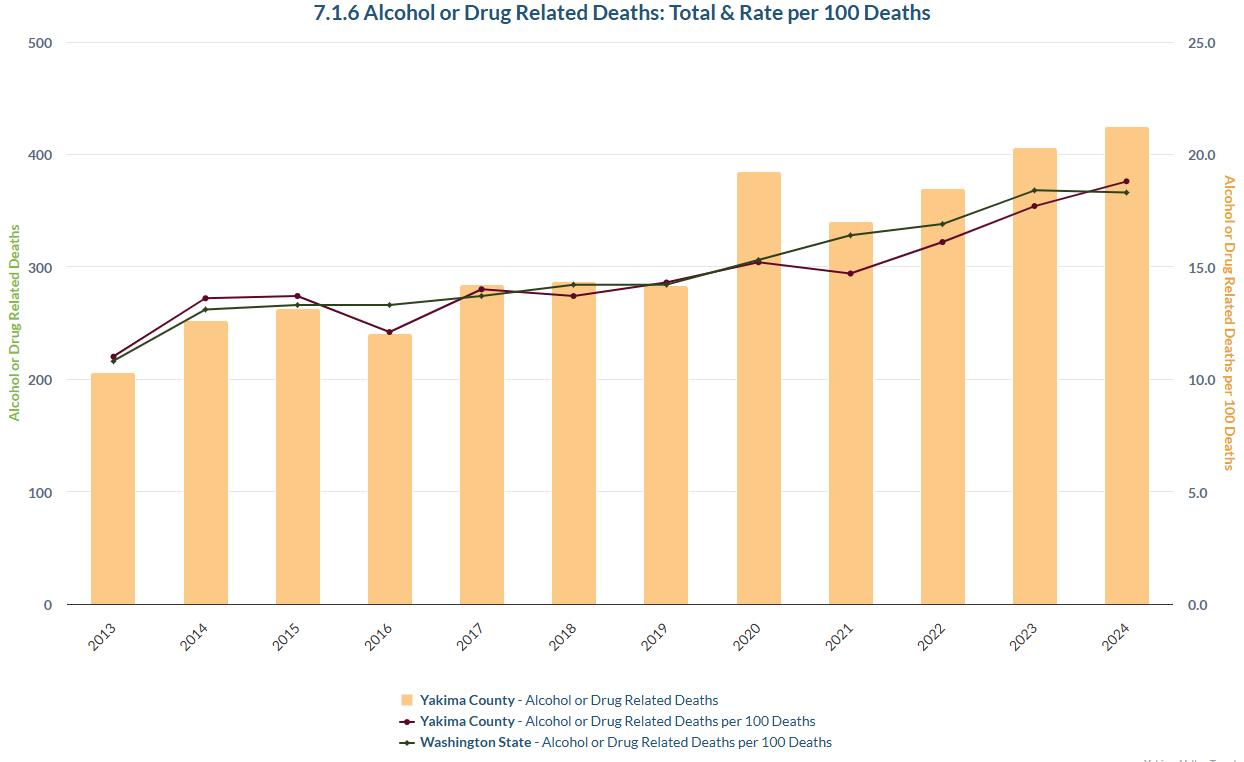
The rate of deaths from substance abuse continues to climb.
In 2024, total deaths from alcohol or drug abuse hit a record of 425. This represented 19% of all deaths in the county,
A decade ago (2015), the comps were 263 deaths, representing 14% of all deaths. 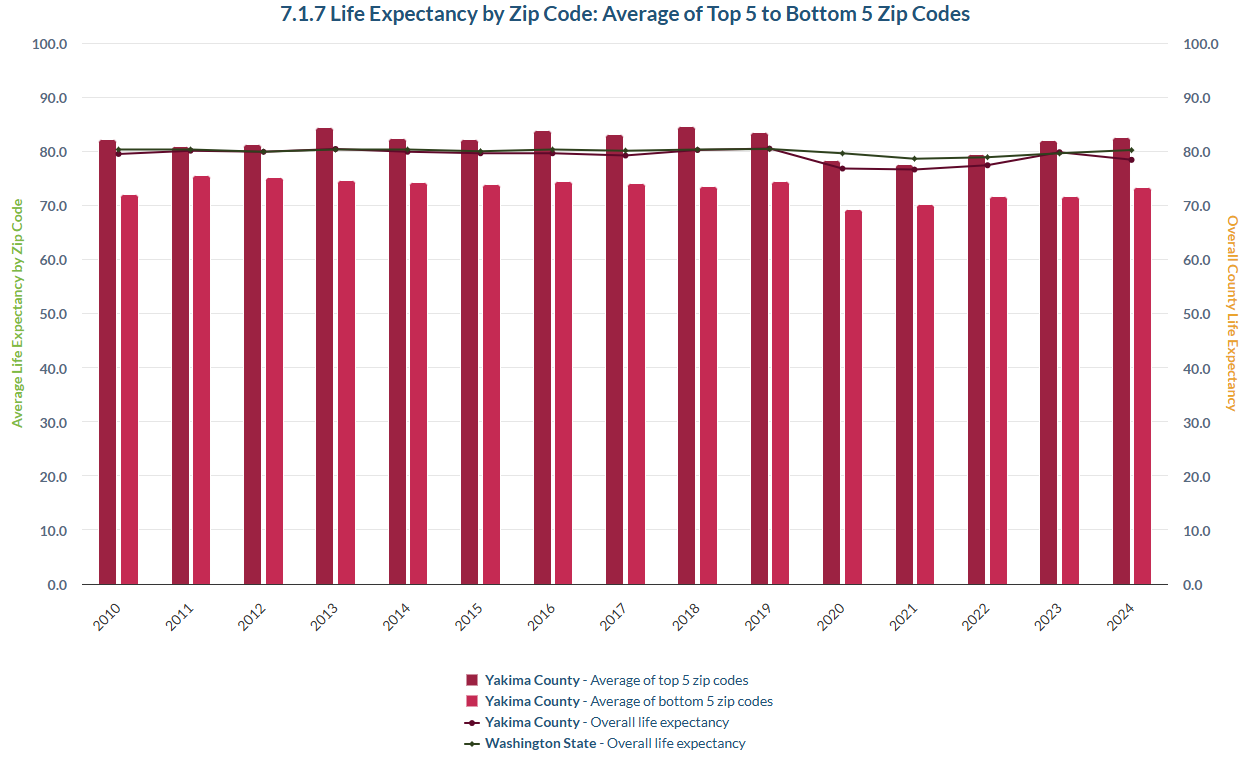
Life expectancy in the county varies by zip code.
Unfortunately, where you live in the county predicts how long you will live. This indicator looks at average life expectancy of the five zip codes with the highest to the five zip codes with the lowest.
For the most recent year (2024), the average of the top five was 82.6 years while the average of the lowest five was 73.2. A decade ago (2015), similar expectancies were 82.2 and 73.9 years. In general, life expectancy took a big dip during the pandemic in the county. It still hasn’t recovered overall, and for both sets of zip codes.
To simplify the graph, click on the item(s) in the legend you would like to hide.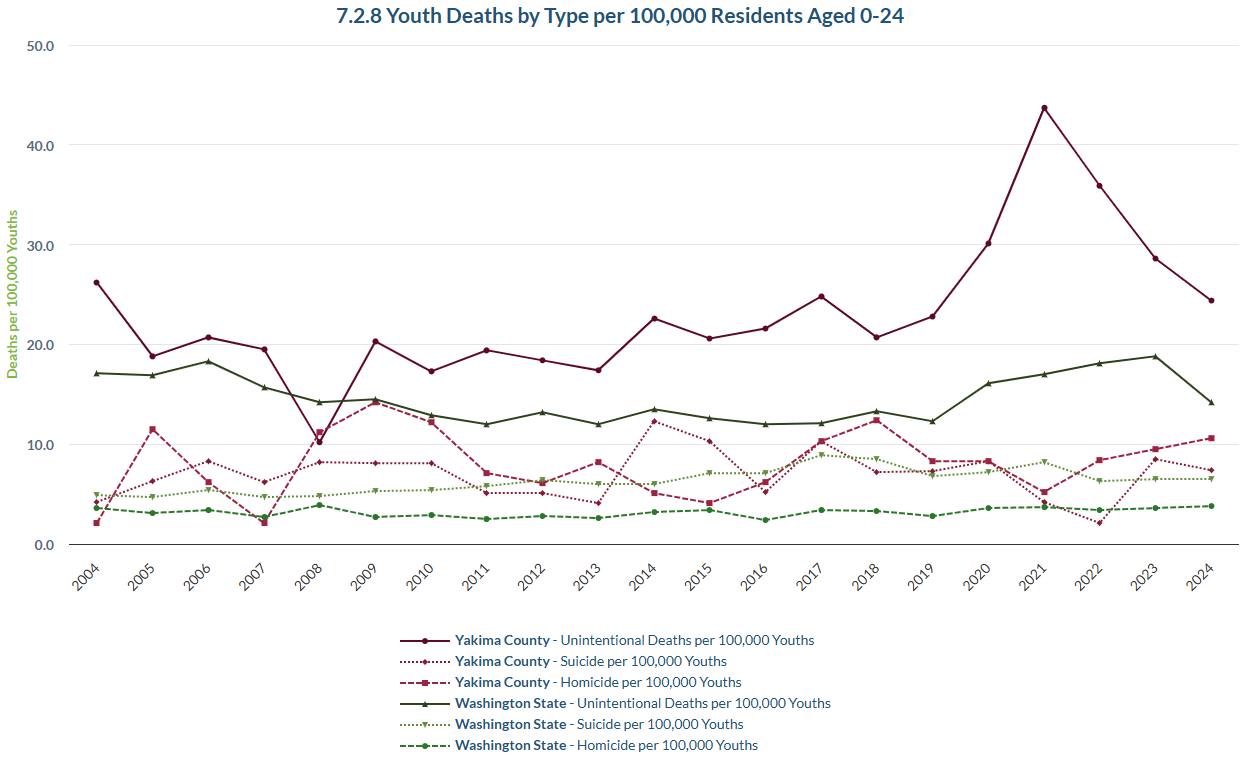
In 2024, the largest source of death among youth – unintentional – was 24 per 100,000, or 0.2 per thousand residents age 0 to 24. That is about the average rate for the three-year period 2004-2006.
Youth death by suicide in 2024, however, was higher than the three-year average near the start of the century: 7.4 per 100,000 versus 6.3 earlier. And youth homicide rates were considerably higher: 10.6 per 100,000 vs. 6.6.
While youth suicide rates here are largely the same as those statewide, deaths from the other two types are higher here.
To simplify the graph, click on the item(s) in the legend you would like to hide.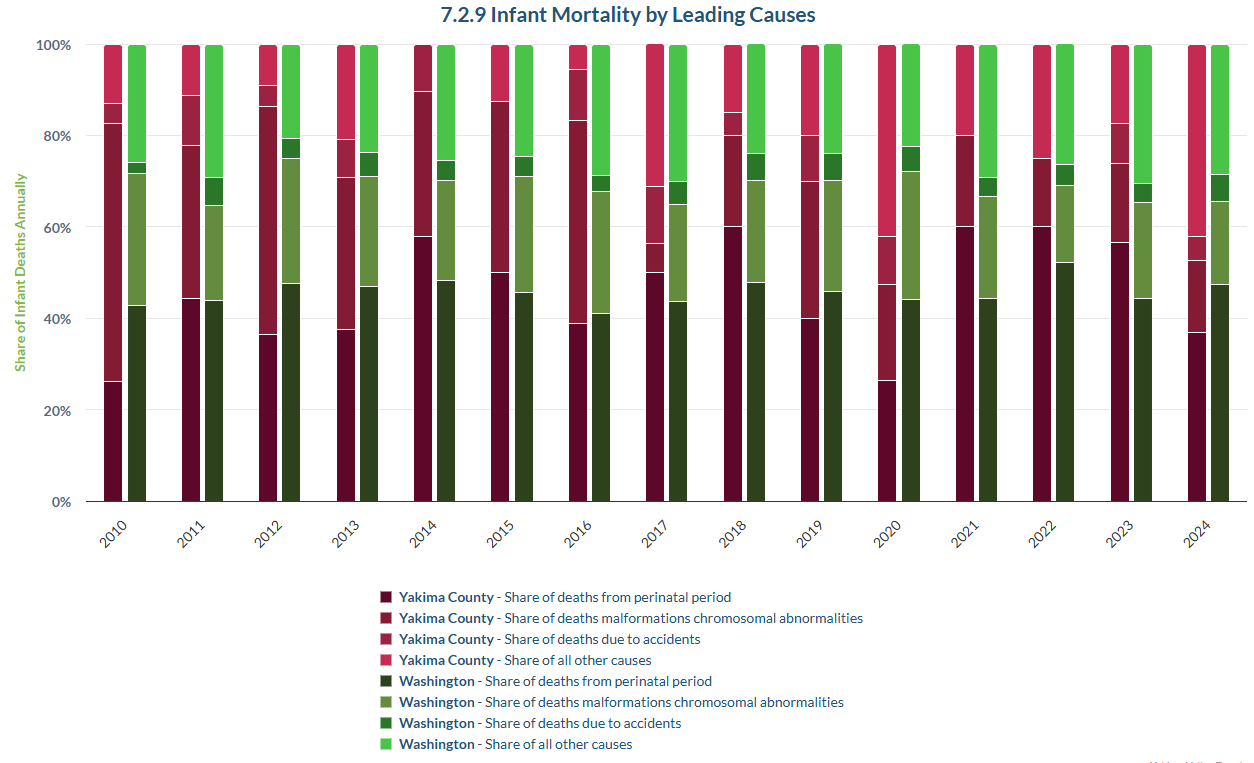
The first year of a person’s life can be fraught with danger. It is the goal of families and healthcare professionals to reduce the odds of dying to zero. This indicator measures the shares of causes of infant deaths to three specified causes, then to an “all other” category.
For Yakima County infants, the largest individual category has been during the perinatal period. In three of the past four years (up to 2024), the share of deaths here has been higher than a decade ago. Shares in the other two specific categories – accidents and malformations – have declined a bit. This implies that the size of the “all other” category has grown.
To simplify the graph, click on the item(s) in the legend you would like to hide.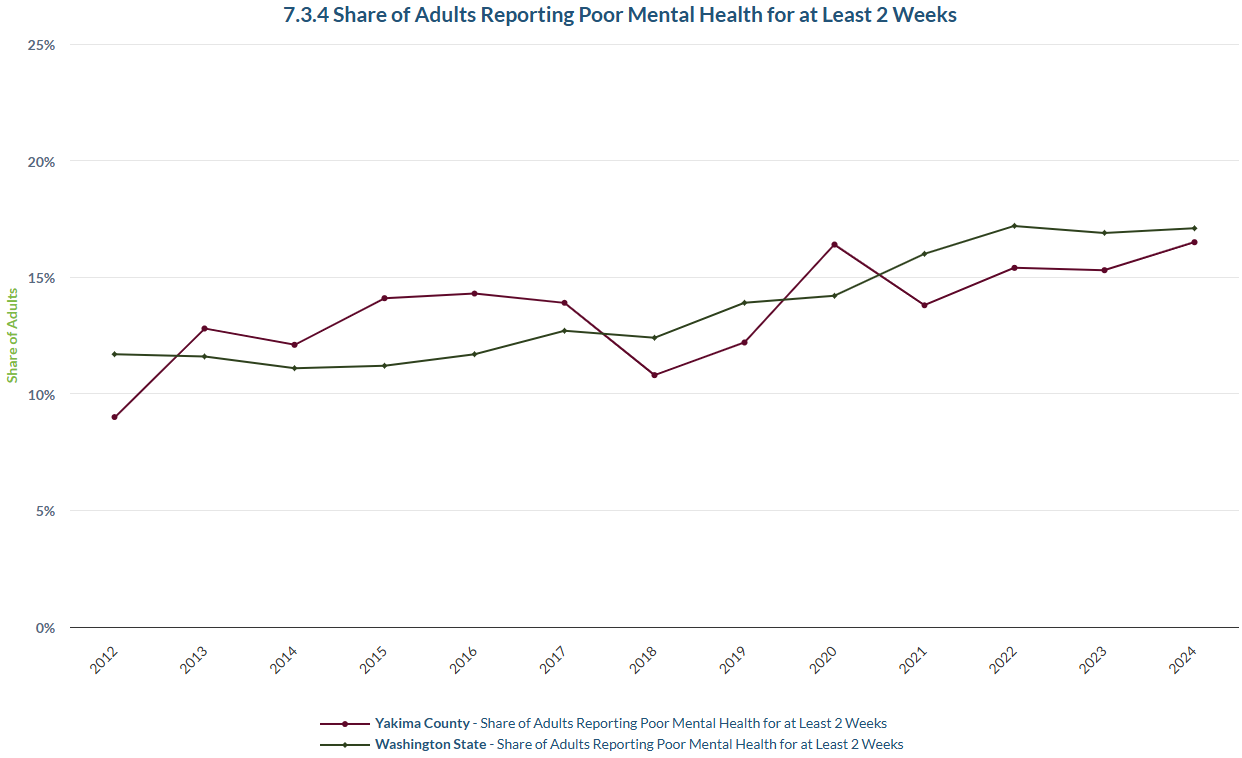
The share of adults reporting poor mental health has doubled over the past decade in Yakima County.
According to the Centers for Disease Control, the share of county adults (18+ years) who report dealing with poor mental health in at least half of the past month has nearly doubled since 2012. Currently (2023), the share stands at about 18%.
The upswing in the county rate has largely followed that of the state average, although for 2023, the county rate is higher.
In HOUSING: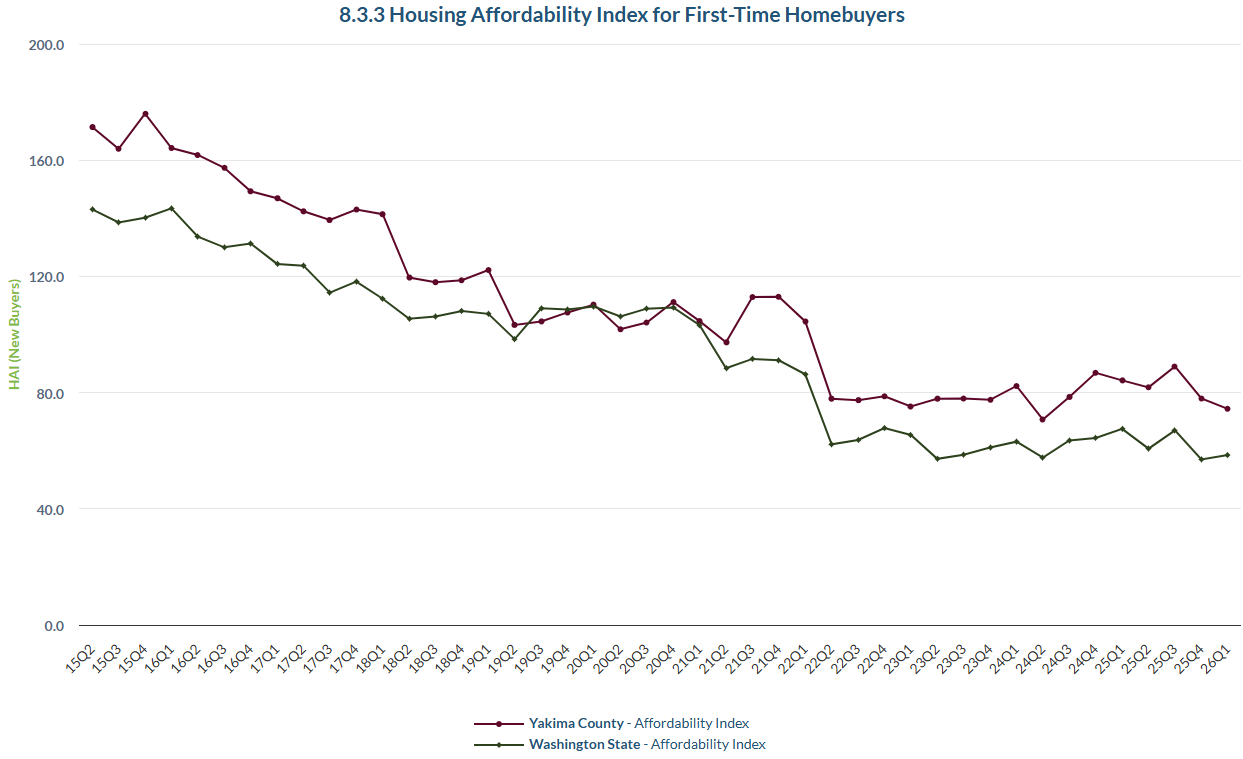
The first-time buyers housing affordability index (HAI) has recently nudged upward.
While many take interest in housing prices, what matters to would be buyers is price in the context of their incomes. Even if housing prices climb steeply, if incomes also do the same, then perhaps no harm, not foul in the marketplace.
Housing economists express this relationship in an index, with a measure of income in the numerator and housing cost (mortgage) in the denominator. For this version of the index, the numerator is the income of household at 70% of the county median, while the denominator is based on 85% of the current quarter’s median house price. Further assumptions include a 10% down payment and a fixed, 30-year mortgage.
An index value of 100 implies that this type of household purchasing this level of “house,” will spend no more or less than 25% of its income on the house. A value above indicates that the household has more than enough income to spend on the house.
Unfortunately, as the graph clearly shows, the HAI value for this buyer has remained well below 100, or the affordability threshold, since 2022. And little progress has been made since then. Of course, the county remains relatively more affordable than the state average, but by the HAI measure, still unaffordable.
last updated 04.26.26
New Intern Features

Janay Bowen
Hometown: San Jose, CA
Major: Professional Accounting
Expected Graduation Date: Spring 2027
Post-graduation plans: Work at a local accounting firm to become a CPA.
After a few months of working on the Trends project, my favorite thing so far: My favorite thing so far is when I get into the flow state of work, and I am understanding and creating spreadsheets that I know help the counties we work for.
The complete list of Yakima Valley Trends can be found here.